Shopping is Singaporeans’ favourite habit given that we don’t have much scenery to look at…
And there are a number of retail REITs that are listed in Singapore such as:
- CapitaLand Integrated Commercial Trust
- Lendlease Global Commercial REIT
- SPH REIT
- Starhill Global REIT
- Frasers Centrepoint Trust
It can be tough to choose which retail REIT to buy for your portfolio and we decided to compare two popular Retail REITs: Lendlease Global Commercial REIT (LREIT) and Frasers Centrepoint Trust (FCT).
Let’s take a look at each of the REIT’s variety of attributes to decide which REIT wins the battle…
1. Retail REITs Portfolio Composition
First, we look at each REIT’s portfolio composition.
Based on the website, Lendlease REIT’s portfolio comprises a leasehold interest in 2 properties located in Singapore (JEM and 313@Somerset) and one office complex in Milan with a total appraised value of S$3.6 billion.
Frasers Centrepoint Trust (“FCT”) is one of the largest suburban retail mall owners in Singapore with total assets of approximately S$6.1 billion. It owns a total of 9 retail malls near homes and within minutes to transportation amenities including Causeway Point, Changi City Point, Waterway Point (40%-interest), Tampines 1 and more.
For this segment, FCT is clearly the winner as suburban malls are more resilient should there be economic headwinds next year.
2. Financials and DPU
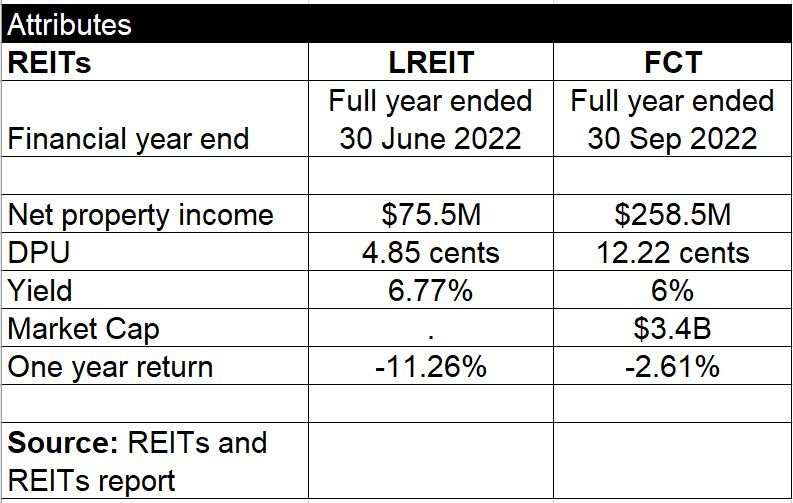
Moving on to financials, we used the fiscal year end 2022. LREIT has a net property income of $75.5M while FCT net property income is $258..5M. Since FCT has more properties, the REIT property income will be much higher.
On this note, we should compare the two Retail REITs’ DPU growth and distribution yield especially for income- seeking investors. For the former, LREIT has grown its DPU from 4.1 cents during its first full year of listing to 4.74 cents in 2021, while FCT has grown its DPU from 6.55 cents since its first full year listing in 2007 to 12.22 cents in 2022.
It will be difficult to indicate which retail REIT is better in terms of DPU growth as LREIT has a much shorter listing history.
For the latter (yield), LREIT is the winner here with 6.77% yield while FCT yield is lower at 6.0%.
However, if we look closer at the share price performance of LREIT, the return is -11.26% over 1 year period compared to FCT which is flat at -2.61%. Adding both the yield and share price performance would mean that FCT ends up the winner this round.
3. Gearing Ratio and Interest Coverage
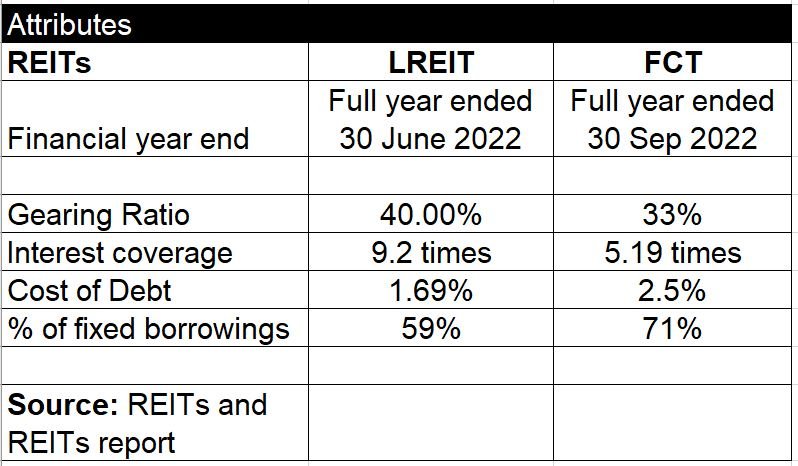
A REIT’s debt metrics determine if it has room to tap on borrowings for acquisitions and whether it can be resilient to interest rate increases.
The table above shows that FCT has a lower gearing ratio of 33% versus LREIT’s 40%. Anything gearing 40% and above may signal a potential fund raising exercise which could be detrimental to shareholders.
FCT also enjoys a higher fixed borrowings of 71% compared to LREIT of only 59%. A lower fixed borrowings percentage could spell trouble as interest rates are expected to increase further next year.
On this note, FCT emerges as the winner too.
4. Operating Metrics
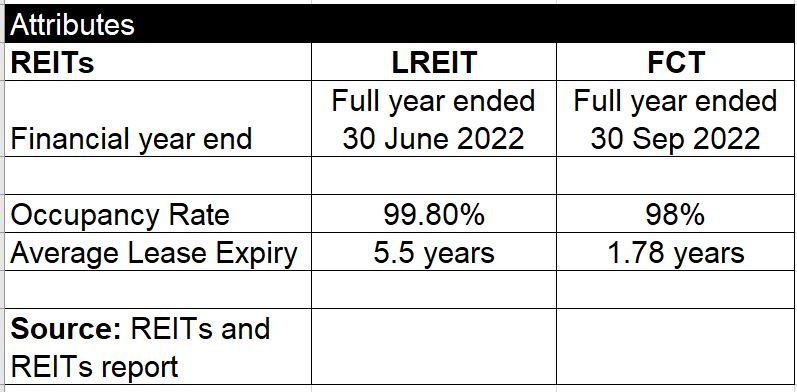
Both LREIT and FCT have strong operating metrics, with each REIT boasting a high occupancy rate of above 95%. However, LREIT has a longer average lease expiry of 5.5 years.
A longer lease to expiry is better in times of economic downturn so LREIT ekes out a minor win this round.
5. Battle of Retail REITs – Conclusion
To sum up, FCT scores a “hat-trick” out of the 4 aspects we look at above. That being said, investors will also have to contend with the threat of E-commerce and how retail spending will change in a looming recession.
Investors still need to be aware of the risks involved and do your own due diligence.
You can find the REITs websites here and here.