Japan Foods Holding (JFH) has recently caught my attention, after I have started screening for stocks again. JFH operates a wide range of F&B outlets selling Japanese food.
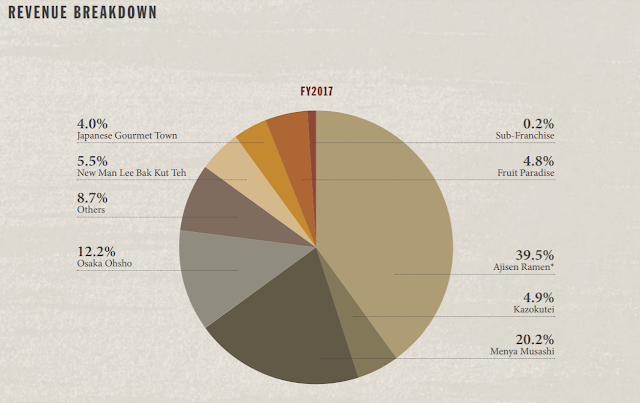
We may be familiar with the Ajisen Ramen brand, which accounts for the bulk of JFH’s revenue (39.5%). JFH also operates brands including Menya Musashi and Keika Ramen. It has operations in Singapore, Malaysia, Vietnam, Hong Kong and China.
 |
| JFH Annual Report 2017 |
The firm has a four pronged strategy to grow its business – developing new concepts, cost control, overseas expansion and network expansion/consolidation.
1. 1H 2018 Financial Results
For 1H 2018, JFH reported an earnings per share of 1.35 cents, compared to 1.53 cents a year earlier, a 11.8% fall. Revenue fell marginally from $33.5 million to $33.0 million.
As at 30 Sep 2017, JFH had $19.6 million in cash and cash equivalents. This makes up more than a quarter of JFH’s market cap of $74 million. Furthermore, JFH has zero borrowings. A healthy balance sheet means that JFH has the financial strength to fund any expansion plans or acquisitions.
2. Increasing Gross Profit Margins
 |
| JFH Annual Report 2017 |
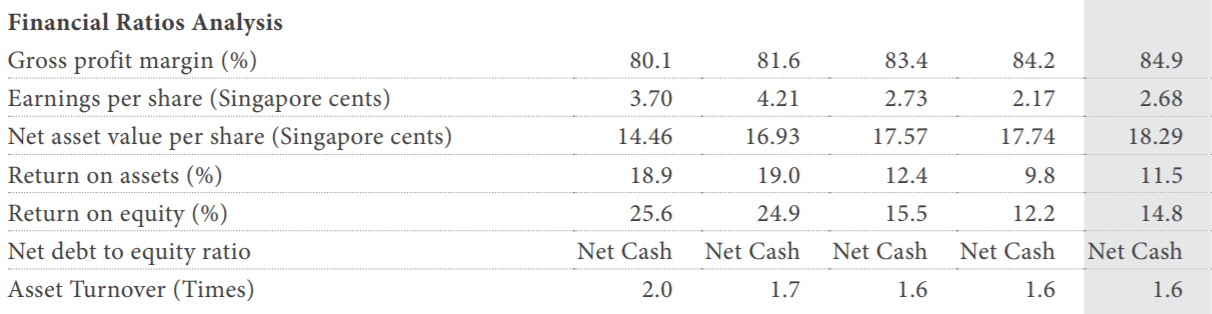
JFH frequently highlights their high gross profit margins, which have been increasing over the past 5 years, hitting a record high of 85% this year. However, if we were to look at their net profit margin, it would paint a different picture. JFH’s net profit margins have been declining over the same period. I’ll be looking deeper into the cost structure of JFH to better analyse these differing trends.
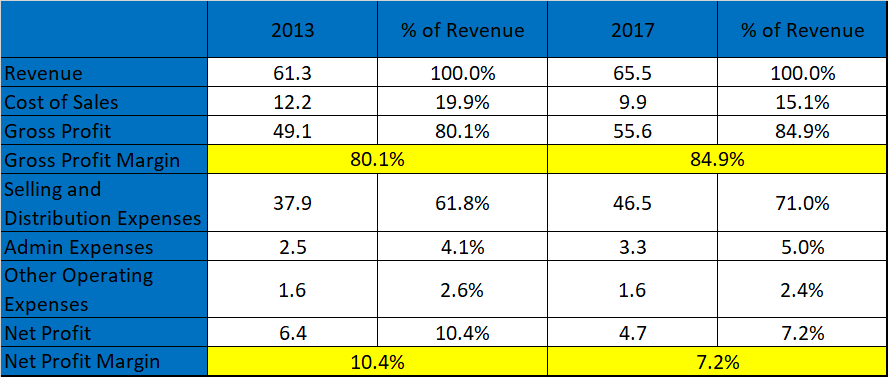
Here is the comparison between the expenses JFH incurred in FY 2013 compared to that of FY 2017:
Firstly, while JFH’s revenue has increased from $61.3 million to $65.5 million, they still managed to reduce their cost of sales from $12.2 million to $9.9 million.
Thus their gross profit margin increased from 80% to 85%. JFH’s increasing gross profit margins signals that they have managed their costs of sale well. Cost of sale mainly consists of the cost of raw materials, which were probably kept low because of bulk purchases and economies of scale.
However, JFH’s net profit margins fell over the same period, from 10.4% to 7.2%. As we observe from the comparison above, this is mainly due to selling and distribution expenses increasing, from $37.9 million to $46.5 million.
Selling and distribution expense is the main component of JFH’s expenses, and rose due to higher wage costs and higher depreciation expenses incurred.
Naturally, the business would incur higher staff cost and depreciation expenses as it expands, as new outlets are set up. However, JFH’s expenses have risen at a faster pace than its growth in revenue, which offsets its increasing gross profit margin, resulting in its net profit declining.
Going forward, JFH is expected to continue facing such cost pressures due to a tight labour supply. We should pay attention to how JFH manages these cost components in the upcoming quarters.
3. Dividend Payout
 |
| JFH Annual Report 2017 |
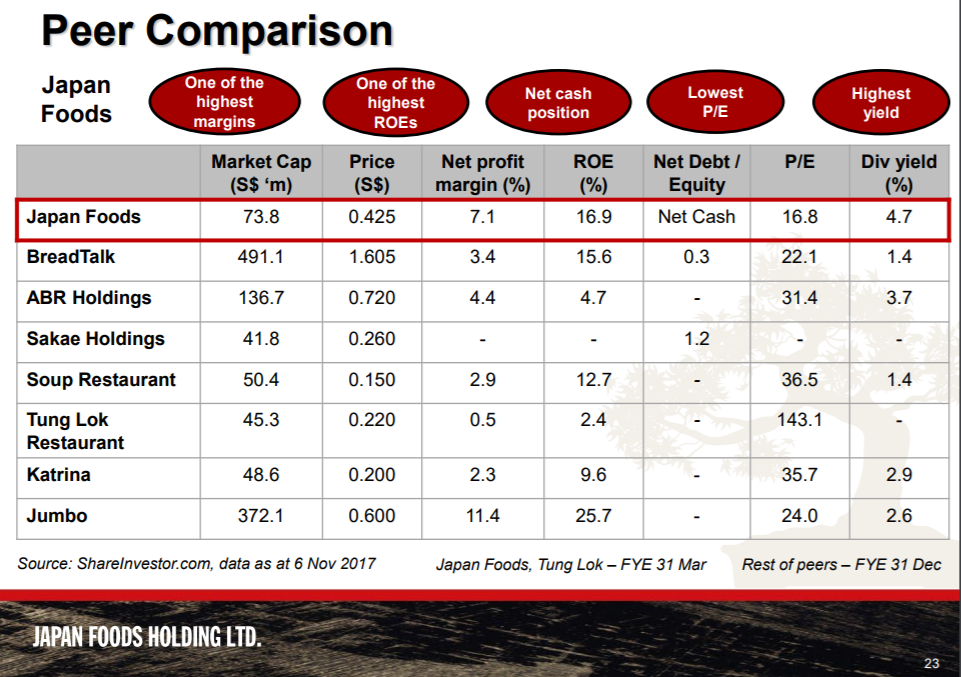
JFH has the highest dividend yield among its peers, at 4.8% as of today’s closing price of S$0.42. However, this is mainly due to JFH’s dividend payout ratio leaning towards the high side.
JFH’s 5-year dividend payout history is shown above. Note that JFH used to payout higher dividends from 2013-2014, then cut its dividends after earnings fell.
 |
| JFH 1H 2018 Results Presentation |
For FY 2017, JFH paid out 75% of its earnings as dividends to shareholders. For some comparison, Jumbo’s payout ratio is around 60%. This is probably because Jumbo still needs to fund its expansions to penetrate new markets, while JFH already has an established network of F&B outlets across the region.
For 1H 2018, earnings per share was 1.35 cents, which gives us a full-year pro forma EPS of 2.7 cents, indicating that JFH would probably be abe to maintain a healthy 75% payout ratio. Interim dividend had increased slightly from 0.75 to 0.8 cents.
JFH currently trades at a P/E ratio of 16x, which is reasonably priced compared to its peers. I won’t say that JFH is undervalued, but given that F&B companies generally trade at slightly higher valuations, I believe JFH’s current share price is still rather attractive.
4. Discounted Cash Flow Valuation
Personally, I’m not really a fan of using DCF to arrive at a valuation, because of how widely the valuation can fluctuate based on the inputs we decide to use. As they say, garbage in, garbage out. However, since a DCF is still an extremely common valuation metric, I’ll still include my DCF-based estimates here.
As JFH is an established F&B chain, and with little expansion plans in the pipeline, the assumptions I used were a discount rate of 9% and a terminal growth rate of 2.5%. I used a 2.5% TGR, which is higher than Singapore’s GDP growth rate, because JFH has still has operations in a number of emerging economies such as Vietnam and China. These countries should experience higher GDP growth rates than us. 18 of JFH’s outlets are based overseas, while 49 in Singapore.
Starting with JFH’s five year average free cash flow of $5.56 million, I arrive at a valuation of $0.51 per share for JFH, which represents a 21.4% upside from today’s price of $0.42.
Notice that if we were to tweak the parameters slightly, the valuation we would arrive at can differ substantially, as we get a range from $0.34 to $0.95. If we were to be more conservative, and apply a higher discount rate of 10% and assume a lower terminal growth rate of 2%, we would have JFH at fair value now.
To me, a DCF is at most rough estimate of the company’s value, and we’ll have to evaluate both the quantitative and qualitative aspects of the business.
5. High Insider Ownership
 |
| JFH Annual Report 2017 |
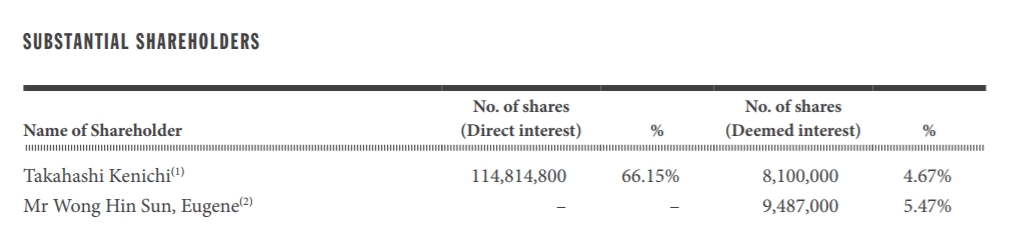
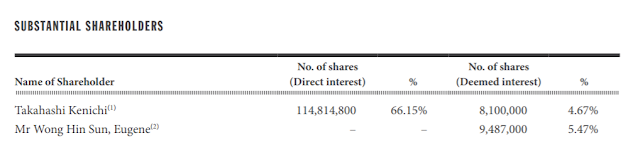
JFH’s CEO, Mr Kenichi, and Non-Executive Vice Chariman Mr Eugene Wong hold a 70% and 5.47% interest respectively. That is a total of more than 75% held by key executives. I prefer companies with high management ownership, because this gives us a much stronger alignment of interest between the management and shareholders.
However, a consequence of this high management ownership results a mere 19% of the outstanding shares being held by the public. Thus, JFH’s trading volume is extremely low, or may not even be traded on some days. Investors may face liquidity risks if they have to cash out urgently.
Conclusion
While JFH is a small cap stock, I believe that it has a geographically diversified and stable business. If JFH is able to keep its costs in check, increase its operational efficiency and mitigate its declining net profit margins, JFH could see some earnings recovery.
However, one aspect of JFH I dislike is that they operate too many brands, which results in JFH’s brand equity lagging behind its peers.
Should JFH’s share price fall below $0.40, with little change in fundamentals, I believe that it would present a good opportunity to purchase a solid, cash flow generating company. At that price, we would be receiving a dividend yield in excess of 5%.
However, as I’m currently a shareholder of Jumbo, should I purchase JFH’s shares, my portfolio would become slightly heavy on the F&B sector.
SmallCapAsia.com is a website focused primarily on undervalued gems that can generate Big, Fat Returns for investors. Our Slogan is simple: Start Small, Win Big!
Subscribe to our FREE e-newsletter to get a regular dose of investing insights not found elsewhere!