Once a REIT darling, Mapletree Industrial Trust (MIT) share price has stagnated in the past 5 months or so after falling from a high of $3.30 to $2.38.
As at 31 December 2022, MIT’s total assets under management was S$8.8 billion, which comprised 85 properties in Singapore and 56 properties in North America (including 13 data centres held through the joint venture with Mapletree Investments Pte Ltd).
MIT’s property portfolio includes Data Centres, Hi-Tech Buildings, Business Park Buildings, Flatted Factories, Stack-up/Ramp-up Buildings and Light Industrial Buildings.
Without further ado, lets do a deep dive into the REIT based on its financial results for 3QFY22/23.
1. Financial Metrics
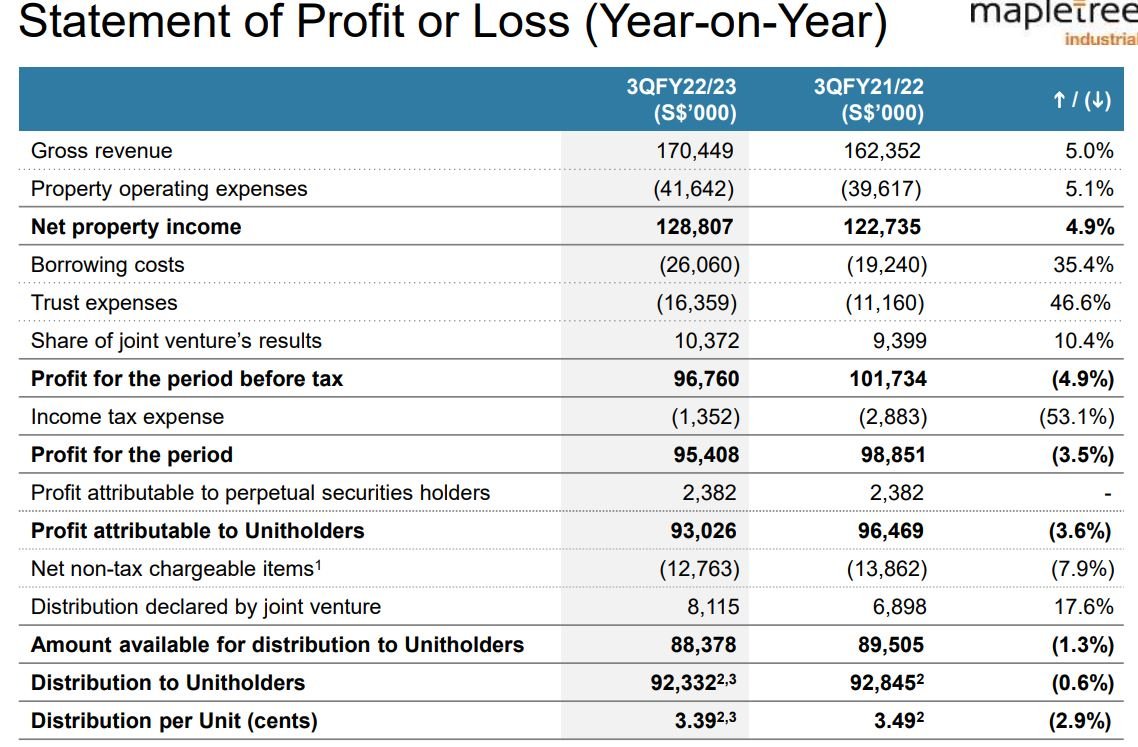
MIT net property income is up 4.9% to S$128.8M for FY 3QFY22/23 while DPU is down 2.9% to 3.39 cents. This is mainly due to the increase in shares issue from the Dividend Reinvestment Plan.
MIT reported higher occupancies and positive rental revisions across most property segments in Singapore. The DPU of 3.39 cents also includes the distribution of net divestment gain of S$15.7 million from 26A Ayer Rajah Crescent over eight quarters from 2QFY21/22 to 1QFY23/24.
It also includes the distribution of tax-exempt income of S$6.6 million withheld in 4QFY19/20 over three quarters from 3QFY22/23 to 1QFY23/24.
Generally, with increase in net property income, we should see an increase in DPU even with increased in the number of shares.
Hence, there may be a cause for concern for DPU growth going forward especially after 1QFY23/24 once the distribution of net divestment gains runs out…
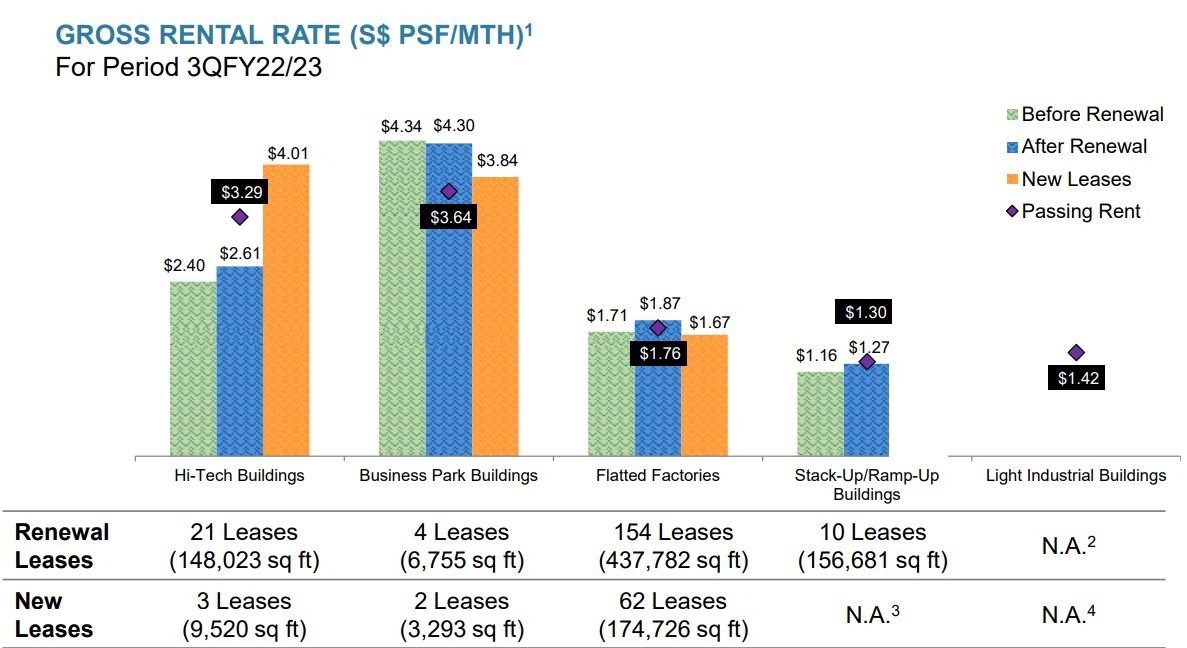
For period 3QFY22/23, we can see that Business Park Buildings and Flatted Factories experienced a drop in rent for new leases.
With the expected slow down in the economy, it is important to observe for any further drop in rent for new leases especially for the Business Park Buildings.
2. Strong Balance Sheet
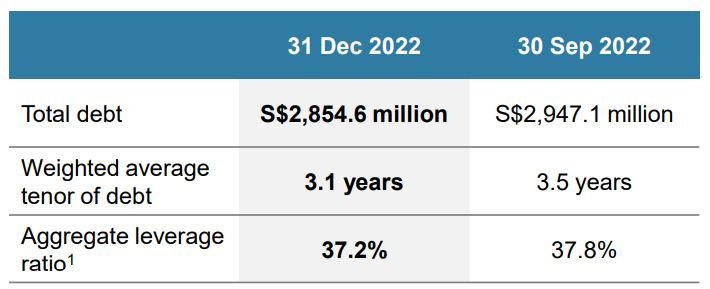
Despite a mixed bag of results from the financial metrics, MIT is still able to maintain a strong balance sheet with gearing ratio dropping from 37.8% to 37.2%.
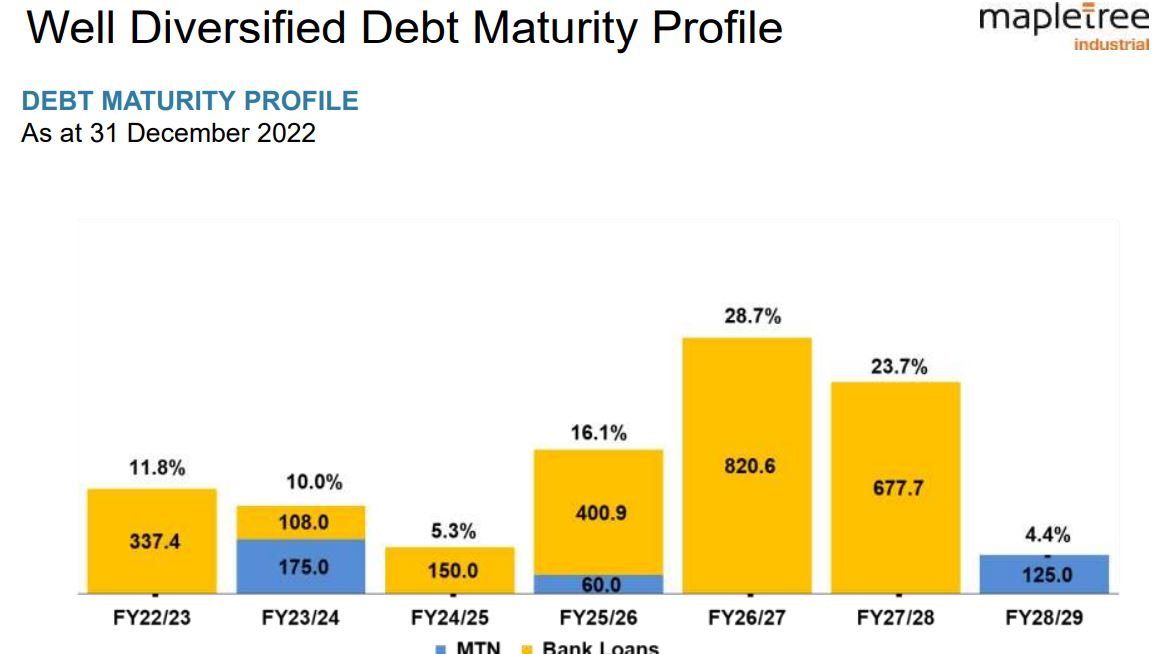
MIT also has a well Diversified Debt Maturity Profile as shown below.
3. Debt Maturity Profile
That said, if interest rates continued to remain high, it could adversely impact the 11.8% and 10% of debt expiring in FY22/23 and FY23/24 respectively.
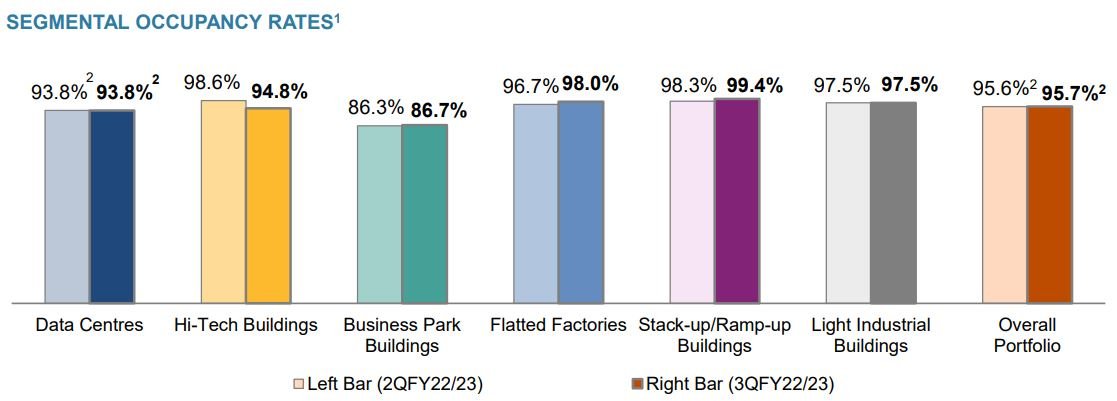
4. Occupancy Rates
MIT overall portfolio occupancy is still healthy at 95.7%. However, investors need to monitor the Business Park Buildings occupancy rates for any signs of deterioration especially with the lower rent for new leases.
5. Conclusion
In summary, MIT deliver a mixed bag of results for 3QFY22/23. While DPU has declined slightly, the overall portfolio occupancy rates remains healthy at 95.7%.
According to its presentation, the commentary was as such:
The uncertain global outlook and the lacklustre manufacturing momentum may persist in the year ahead
All in all, investors need to monitor MIT closely for any sign of deterioration in the financial performance.
You can view the REIT website here.

