Did you know that there are around 14 retail REITs listed in Singapore??
Out of the 14, 8 Retail REITs have local retail properties located in Singapore – indicating how integral shopping malls are to our lifestyle.
The table below shows the 8 retail REITs in order of ascending market capitalization (from smallest to largest).
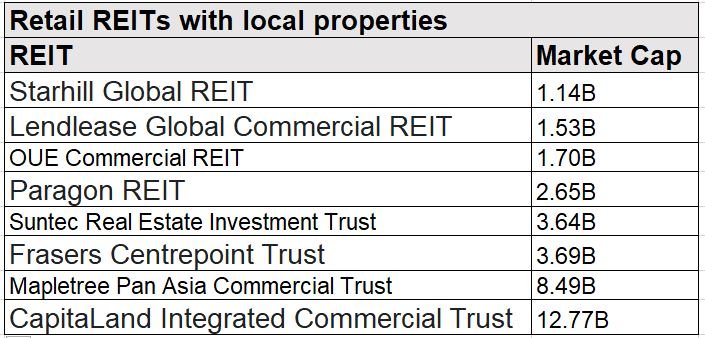
In this article, we will touch on 4 Retail REITs that have garnered significant interest recently and also do a comparison at the end:
- CapitaLand Integrated Commercial Trust (CICT)
- Mapletree Pan Asia Commercial Trust (MPACT)
- Frasers Centrepoint Trust (FCT)
- Lendlease Global Commercial REIT (LREIT)
With that, lets dive in!
1. CapitaLand Integrated Commercial Trust
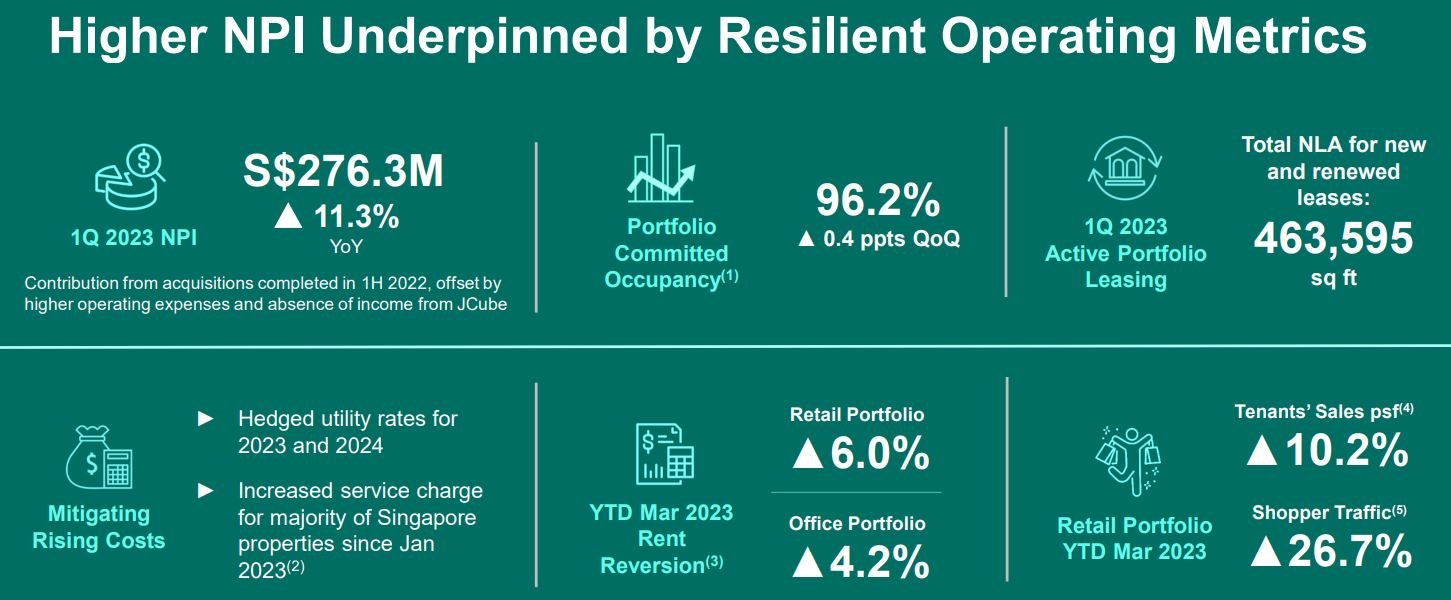
In its latest business update ended 31 Mar 2023, CICT reported net property income increased by 11.3% to S$276.3M mainly from the acquisitions completed in 1H2022.
Overall portfolio occupancy is up slightly to 96.2%. Is worth to note that portfolio occupancy for its retail properties is even higher at 98.5% while its occupancy for its office properties is lower 94.8%.
Another to take special note is its Australia office properties occupancy which is much lower at 83.4%. Is this going to be a cause of concern for its office properties and drag down its DPU in future?
The bright spot is CICT retail properties. Tenants’ Sales is up 10.2% while Shopper Traffic is up a whopping 26.7%! Rental reversion for its retail properties is up 6% YTD. It is good to note that its office properties has a lower rental reversion of 4.2%.
Could its office properties be a reason that the share price has underperformed YTD compared to the FTSE REIT index? CICT share price has dropped 2.46% YTD.
CICT gearing ratio is 40.9% which might be a cause for concern as it might increase the possibility of raising equity which could dilute shareholders’ value. In addition, interest cover has gone down from 3.7x in Dec 2022 to 3.4x in Mar 2023.
You can view the REIT website here.
2. Mapletree Pan Asia Commercial Trust

In it full year results ended 31 March 2023, MPACT reported FY22/23 net property income up 62.6% yoy to S$631.9 million boosted by contribution from properties acquired through the merger and better performance of core assets.
Full-year DPU totalled 9.61 Singapore cents, up 0.8% yoy. Gearing has a huge jump from 33.5% to 40.9%. This could be a cause for concern going forward with such a big jump in gearing ratio. Interest cover has also deteriorated from 4.8x to 3.5x.
Overall portfolio occupancy is 95.4%. Its retail properties of Vivo City and Festival Walk has an impressive portfolio occupancy of more than 99% while its office properties, only its South Korea properties has more than 99% portfolio occupancy.
It is important to note that its China office/business park assets is the worst performer with portfolio occupancy of only 86.5%. In terms of rental reversion, Festival Walk and the China properties has negative rental reversion.
With MPACT having a mixed bag of results, the share price hardly moved and in fact the share price is unchanged YTD.
You can view the REIT website here.
3. Frasers Centrepoint Trust
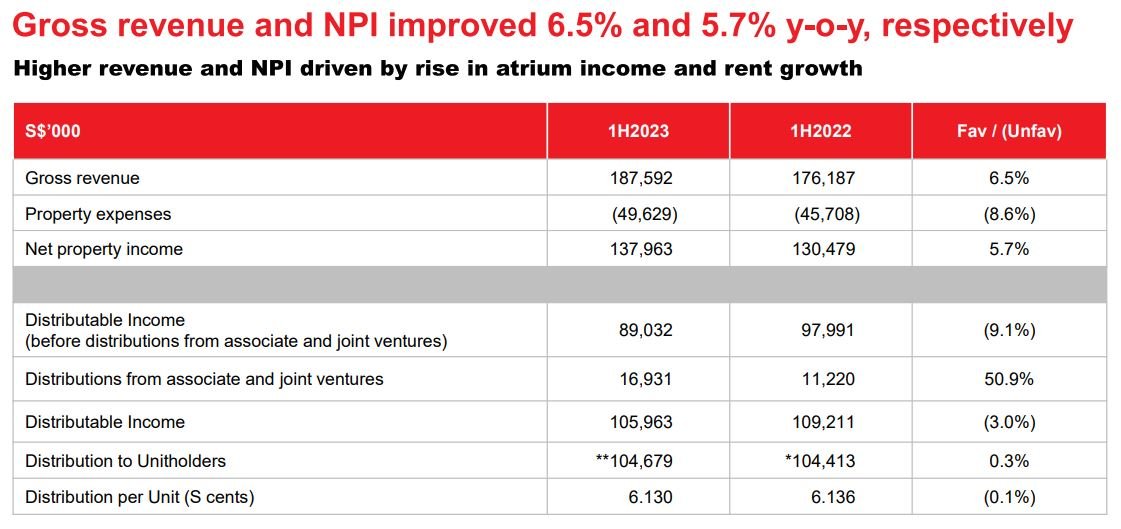
In FCT half year results ended 31 Mar, it reported net property income is up 5.7% to S$137,963M while DPU dipped slightly to 6.13 cents. Portfolio occupancy is the highest among the Retail REITs at 99.2% which is even higher than CICT retail portfolio occupancy of 98.5%.
Gearing ratio is still below 40% at 39.6% compared to the other Retail REITs which is above 40%. Tenants’ sales is 9.2% higher y-o-y and shopper traffic is up 35.3% y-o-y. This bodes well for FCT in their rental negotiations with the tenants.
In fact rental reversion is up an average of 4.3% and its top tenant is blue chip tenant NTUC Fairprice which contribute 4.1% of the gross rental income. As such, its share price way outperform its peers with a 6.28% gain YTD.
You can view the REIT website here.
4. Lendlease Global Commercial REIT
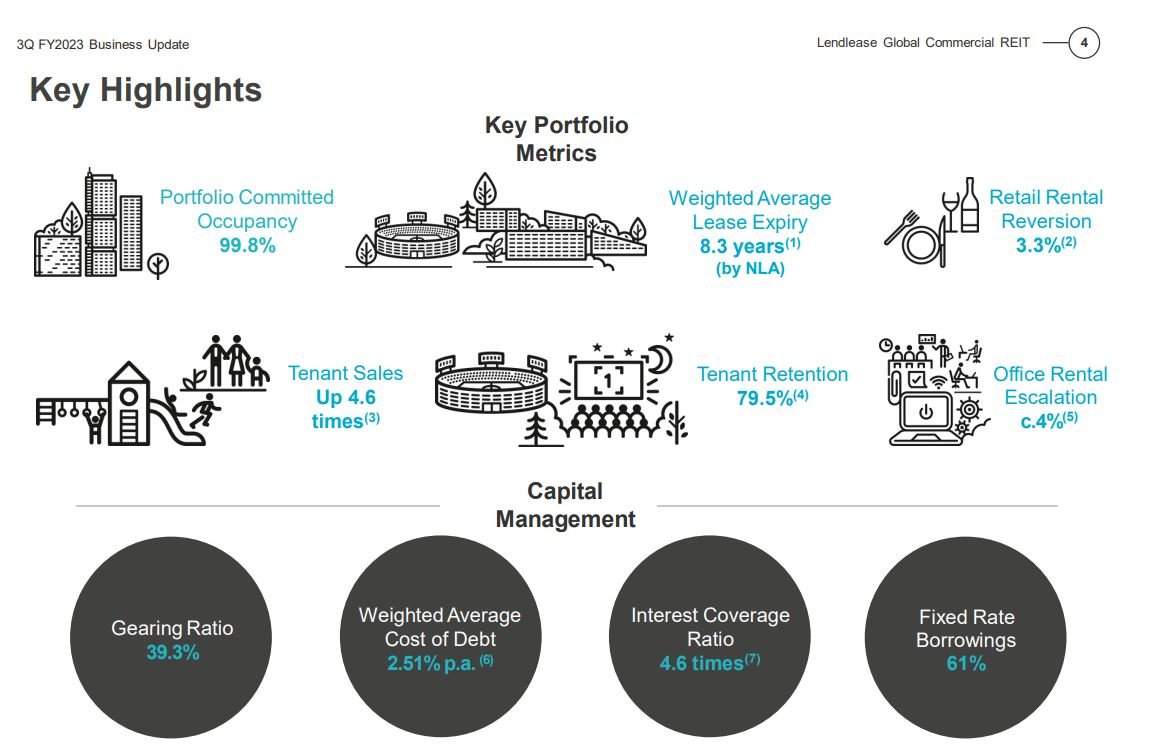
In its latest business update ended 31 March, LREIT reported reported overall portfolio occupancy of 99.8%. Its retail properties occupancy is impressive at 99.5%. The average WALE is 8.3 years mainly due to long WALE of its office portfolio of 12.2 years.
Tenant sales and visitation is up 4.6 times and 2.7 times yoy respectively mainly due to the acquisition of JEM. Retail Rental reversion is up 3.3%.
Gearing ratio is 39.3% while interest cover is at 4.6x. However, gearing ratio will increase to 40.4% with the acquisition of 10% interest in Parkway Parade and it will be a DPU accretive.
The share price of LREIT has fallen by 5.63% YTD and is the worse performer among the four REITs mentioned. Could this present a bargain opportunity for investors with yield of 7.3%?
You can view the REIT website here.
Summary of the Retail REITs

From the table above, among the 4 Retail REITs, Lendlease REIT has the highest yield of 7.3%, longest WALE of 8.3 years and a good interest cover of 4.6x.
While its gearing ratio is going to be manageable even after the acquisition of Parkway Parade, investors need to take note that Lendlease REIT has perpetual securities on its balance sheet and will push up the gearing ratio if you were to include them.

Comparing Lendlease REIT to the peers also shows how it is trading at a cheaper P/B ratio – probably due to its smaller size in market cap.
All in all, with the share price hovering near 52 week low and an attractive yield of 7.3% coupled with the acquisition of Parkway Parade, Lendlease REIT might just present a bargain for investors.