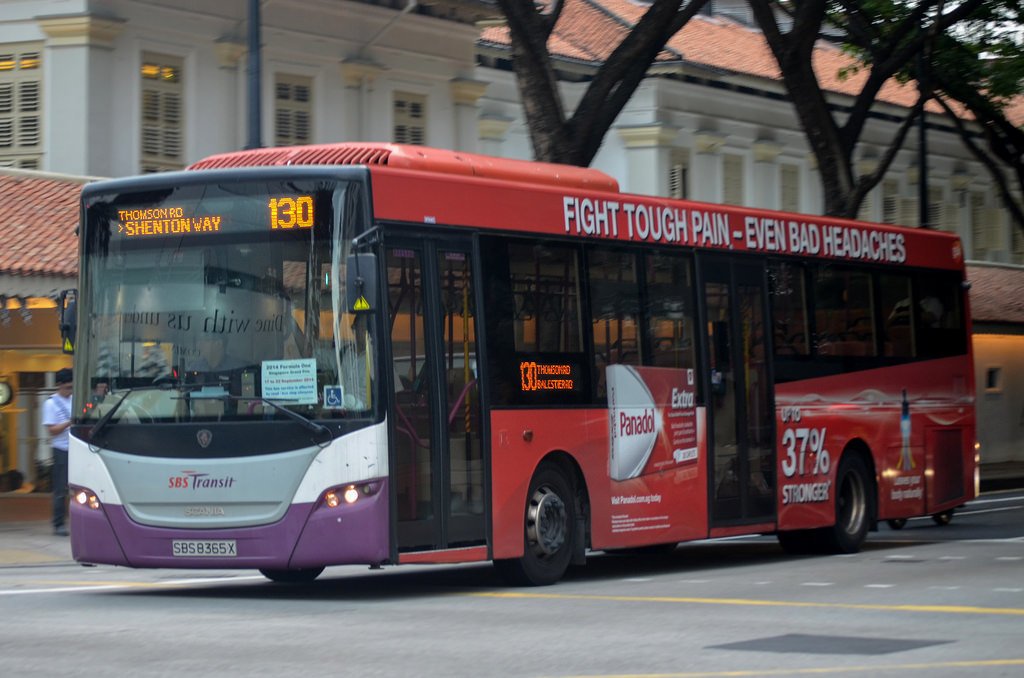
Let us talk about the latest comeback kid in the SGX today – SBS Transit Ltd.
As I write, its stock price is trading at S$ 4.00 per share, which is a jump of 33% from S$ 3.00 as at end-January 2019 and an eye-popping 233% growth from S$ 1.20 levels as at mid-April 2014. Indeed, it is impressive, considering that it had been battered down from its peak of S$ 3.80 a share in May 2007.
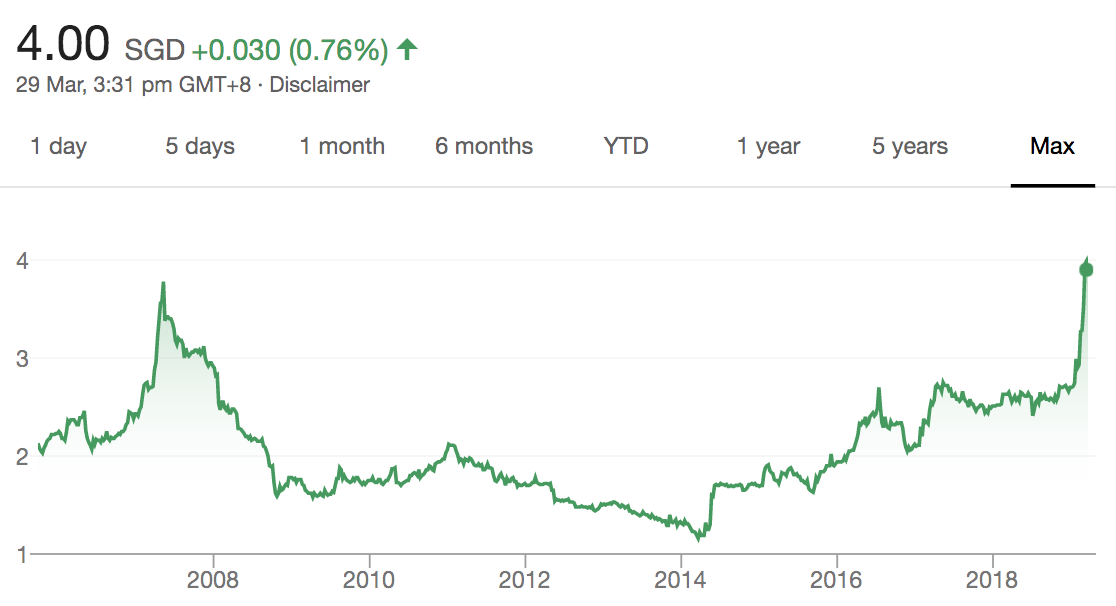 Source: Google Finance
Yup, the frenzy for SBS is on as evident with the sharp spike shown at the right hand corner of the stock price chart above. So, are you excited to grab yourself a couple of SBS’s shares in the stock market today?
If you are, please hold your horses. Take 10 mins to read this article before you decide on anything.
Because in this article, I’ll expound the possible cause for its tumble in stock price in the past and its impressive recovery in the present. Finally, I’ll end my discussion by calculating its valuation figures based on SBS’s today’s stock price of S$ 4.00 per share.
So, without further ado, let us begin:
1. Why the Tumble in Stock Price in 2007 – 2014?
Upon some digging, I discovered that the following events could have potentially led to a tumble in SBS’s stock price during the period. They are:
a. SBS incurred 43.1% higher fuel & electricity costs in 2008.
b. SBS has lower sales due to temporary fare reduction in 2009.
c. SBS incurred higher costs of fuel & electricity in 2011 – 2013.
d. SBS incurred substantially higher staff costs in 2012 – 2013.
e. SBS incurred start-up costs for Downtown MRT Line in 2012 – 2013.
These significant rise in expenses had outweighed SBS’s continuous rise in revenue during the 7-year period.
Thus, SBS has recorded an ongoing fall in operating profits, especially from S$ 64.7 million in 2010 to only a total of S$ 15.5 million in 2013.
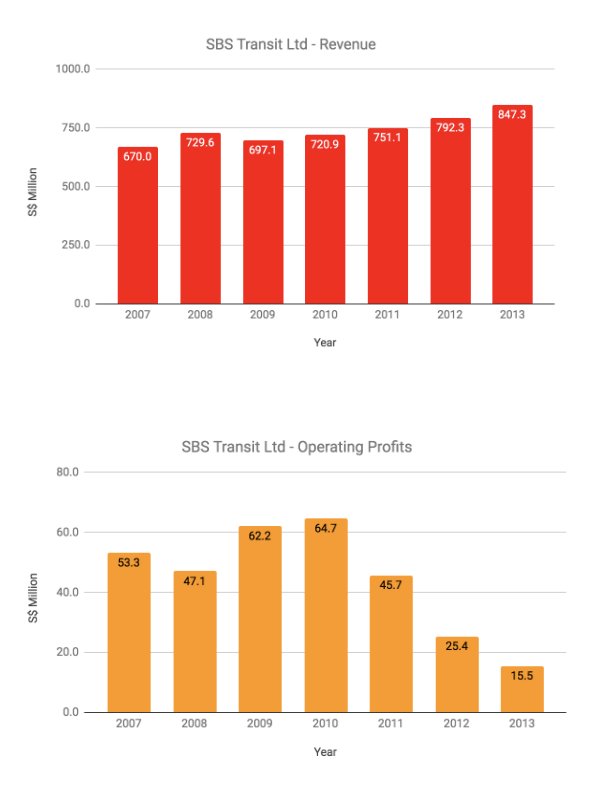
Source: SBS’s Annual Reports
Consequently, it led to a drop in earnings per share (EPS) and dividends per share (DPS), causing its tumble in stock prices during the period.
2. The Execution of Bus Contracting Model (BCM)
In 2016, SBS Transit has entered into public bus services contracts with the LTA under the BCM after its previous Bus Service Operating License expired on 31 August 2016.
Since then, SBS Transit has secured and now is operating 9 bus packages under BCM that covers: 222 bus services, 7 bus depots, 1 bus park, 17 bus interchanges, and 14 bus terminals. In total, SBS utilizes 3,500 buses to operate the 9 bus packages presently.
Under BCM, SBS would derive revenue from:
– Leasing fees of buses to the LTA.
– Service fees indexed to changes of wages, inflation, and fuel costs.
– Advertising and rental income of buses and related assets.
Presently, SBS’s existing bus packages (subject to renewal) would expire on:
|
No. |
Bus Packages |
Year of Expiry |
|
1 |
Sengkang – Hougang |
2021 |
|
2 |
Bedok |
2023 |
|
3 |
Seletar |
2023 |
|
4 |
Bukit Merah |
2023 |
|
5 |
Jurong West |
2024 |
|
6 |
Tampines |
2024 |
|
7 |
Serangoon – Eunos |
2025 |
|
8 |
Clementi |
2025 |
|
9 |
Bishan – Toa Payoh |
2026 |
And surprise, surprise! SBS Transit Ltd also handles many of the new MRT lines – My family is a regular customer of the blue DownTown Line as we live in the west.
Licenses of Rail Services
SBS holds two key licenses to operate the following rail services:
|
No. |
Rail Services |
Date of Expiry |
|
1 |
MRT North-East Line |
31 March 2033 |
|
2 |
Punggol LRT System |
31 March 2033 |
|
3 |
Sengkang LRT System |
31 March 2033 |
|
4 |
MRT Downtown Line |
19 December 2032 |
Source: SBS’s Annual Report 2018
3. Why did SBS’s stock price recover?
After it hit rock bottom of S$ 1.20 in mid-April, SBS Transit stock rebounded and became the ‘comeback kid’ in SGX. So, how did SBS do it?
I believe its comeback is propelled by a few key factors as follows:
– Higher rail revenues from the MRT Downtown Line.
– Continuous rise in bus ridership.
– Lower fuel & electricity costs in 2016 due to a sharp fall in oil price.
SBS’s growth in revenue, this time, had outweighed its increase in costs of operations. Hence, SBS has recorded a significant improvement in its operating profits starting in 2014.
Its profits went from S$ 15.5 million in 2013 to S$ 97.3 million in 2018, translating to an incredible 527% jump!

Source: SBS Transit stock’s Annual Reports
Source: Google Finance
And if I place SBS’s stock price chart with its chart on operating profits…we can clearly see how the SBS Transit stock has fared in comparison to its profits.
This is like what Warren Buffett says: “If a business does well, the stock eventually follows.”
4. SBS Transit Stock Valuations
Here, let us look at a handful of valuation figures:
P/E Ratio:
In 2018, SBS has generated S$ 97.3 million in shareholders’ earnings or S$ 0.257 in earnings per share (EPS). Hence, SBS at S$ 4.00 per share is trading at P/E Ratio of 15.56.
P/B Ratio:
In 2018, SBS has net assets of S$ 1.69 per share. As such, its P/B Ratio is 2.37, which is the highest in 10 years.
Dividend Yields:
In 2018, SBS has paid out S$ 0.129 in dividends per share (DPS). Hence, its dividend yield is 3.23% per annum.
|
Stock Price |
P/E Ratio |
P/B Ratio |
Dividend Yield |
|
S$ 4.00 |
15.56 |
2.37 |
3.23% |
As SBS Transit stock has been following in line with the operating profits, using P/E ratio will be a good gauge.
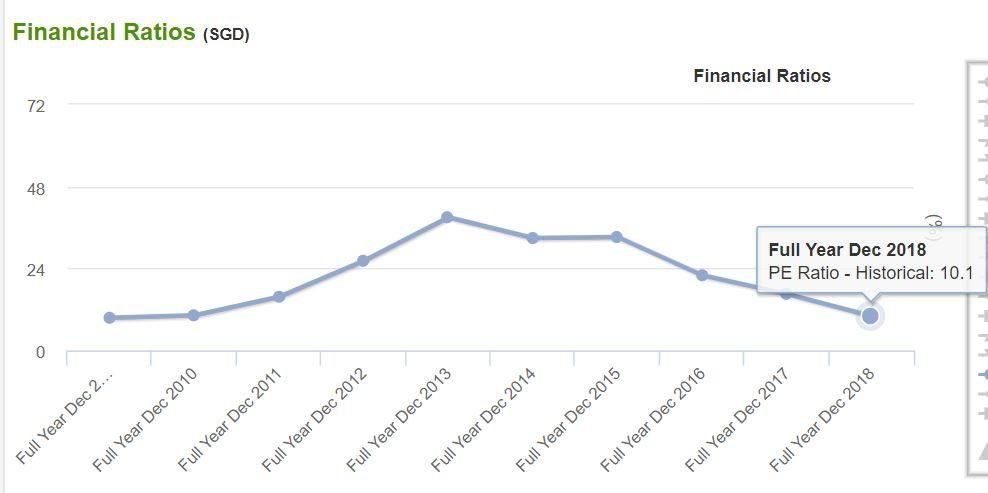 Sourced from Shareinvestor.com
Digging into its P/E ratio for the past 10 years, we can see from the picture above that SBS Transit was actually trading at an all time low at the end of Dec 2018.
This means that in actual fact, SBS Transit’s profits have been rising but share price still hasn’t move in tandem. It resulted in a buyers’ maniac that pushed up SBS Transit share price more than 40% in 3 months time.
5. Our Verdict on SBS Transit Limited
With all that said, naturally the next question people ask would be this:
‘Is SBS Transit a screaming buy at S$4.00?’
The long answer is… we would have to look into its business model, risks involved, management team etc. which we usually cover in our Value Growth membership in InvestingNote. [Let me know if you want to join by emailing me at smallcapasia@gmail.com; I can issue a limited time offer promo-code].
The short answer is…
For some perspective, the STI Index is trading at P/E of 13.6x currently and usually dishes out a 3% dividend yield. In SBS Transit’s case, it is trading at a reasonable valuation with a P/E of 15.5x and 3.2% yield – not too far off from the STI Index’s numbers.
And based on the reports i have read so far, there are no significant growth prospects/catalysts other than the below:
- Higher Bus service revenue from the Seletar and Bukit Merah Bus Packages which commenced operations from March 2018 and November 2018 respectively.
- Upcoming 4.3% fare adjustment effective on 29 December 2018.
- Double-digit increase in dividend payout rates as SBS Transit transforms into an Asset-light servicing model to free up cash.
All in all, SBS Transit still has room to grow in our opinion. But investors should take note that this company is closely intertwined with the Government policies so one need to do your own due diligence.
Are you looking for a daily dose of stock news, reports, commentary & more! Join our NEW Telegram Channel @ https://t.me/StockTake today!
[Free Stock Guide] Psst… We’ve also found 7 exciting companies that are poised to skyrocket >100% in the years to come. Simply click here to uncover these ideas in our FREE Special Report!
